


Monitoring the evolution of electricity and fuel costs is one of the areas of greatest interest for consumers, and is particularly critical for the electro-intensive industry, for which electricity is a fundamental raw material in the production process.
In order to contribute in a simple and objective way to the dissemination of energy cost trends for industry, AEGE’s Barometer presents prices from the national spot and forward electricity markets and from the main European power markets, as well as the evolution of other key elements that make up the final electricity bill paid by industrial consumers, such as system adjustment services, access tariffs, charges and taxes. The price is further reduced by demand-side management services and indirect CO₂ compensations.
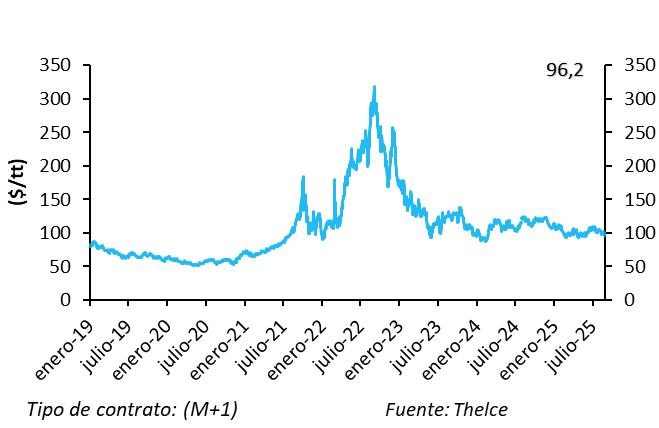
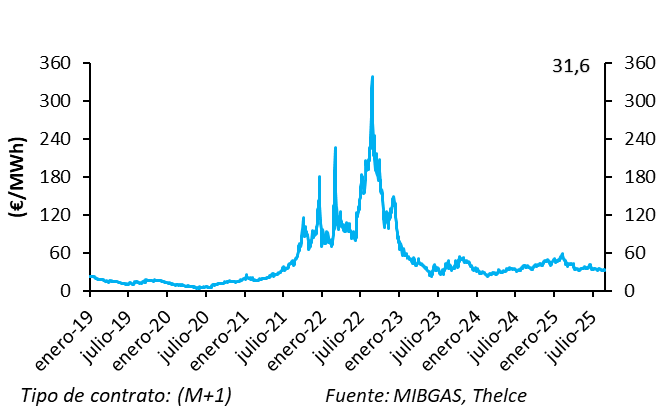
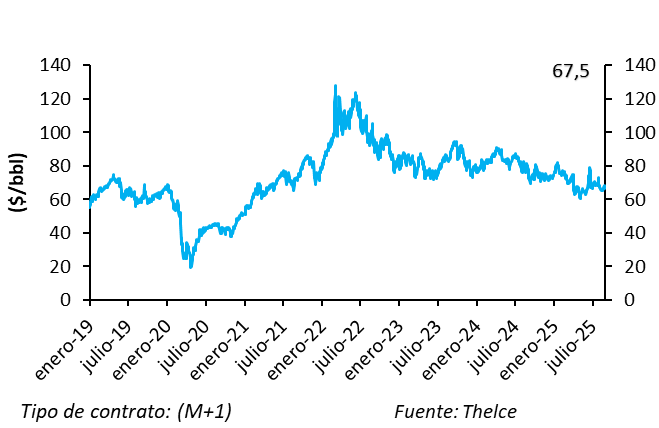
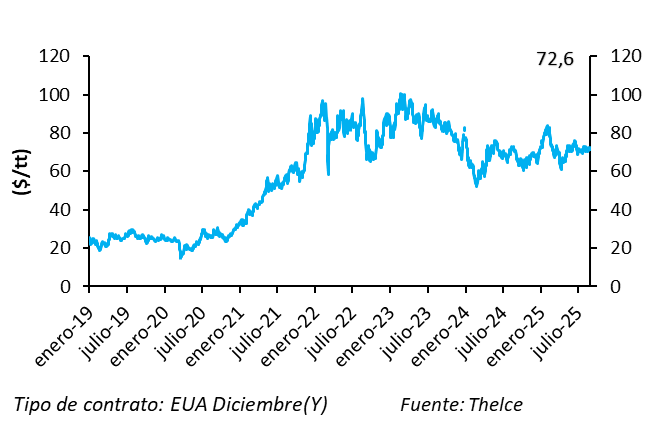
Finally, the Barometer shows prices for the main fuels and energy commodities, such as the price of Brent crude, API#2 coal, the European benchmark natural gas market (TTF), and CO₂ emission allowances — all of which influence, to a greater or lesser extent, the final price of the electricity market. The information presented in the Barometer is updated on a weekly basis.
Graph 1. Comparative final electricity prices in the electro-intensive industry in 2025 (€/MWh)
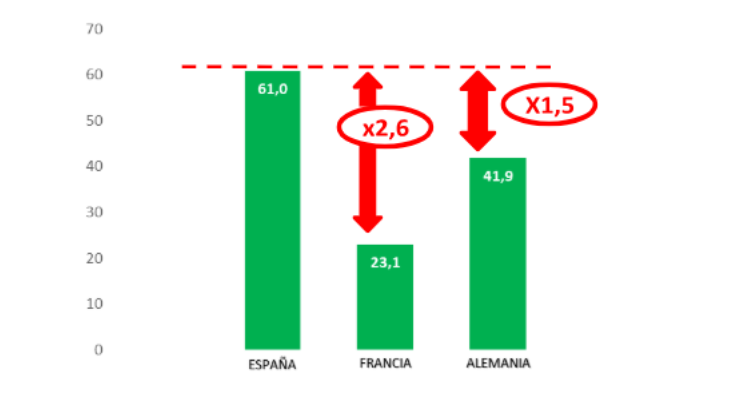
Table 1. Comparative final electricity prices in the electro-intensive industry in 2025 (as at 31/08/25)
| €/MWh | SPAIN | FRANCE | GERMANY |
|---|---|---|---|
| 2025 | Tariff 6.4 | HTB3 Tariff (350kV – 500kV) | MAT Tariff (380kV or 220kV) |
| MARKET (1) | 65.91 | 50.36 | 87.87 |
| SYSTEM ADJUSTMENT & OTHERS | 17.43 | 0.00 | 0.00 |
| ACCESS TARIFFS (2) | 4.07 | 1.04 | 6.98 |
| CHARGES & TAXES (3) | 4.37 | 0.95 | 1.30 |
| DEMAND-SIDE MANAGEMENT | -6.20 | -2.50 | -3.40 |
| INDIRECT CO₂ (4) | -24.60 | -26.80 | -50.90 |
| FINAL COST (€/MWh) | 60.99 | 23.05 | 41.85 |
Consumption: 500 GWh/year.
(1) Value composed of the year-to-date market average plus the average of futures for the remainder of the year.
(2) Network tariffs + losses.
(3) Taxes for Spain: Electricity Tax (IE), Municipal Tax (TM) and National Energy Efficiency Fund (FNEE). VAT is excluded in all cases.
(4) For France, the compensations considered are those set out in European regulations on indirect CO₂ for 2025, capped at 75%. In Germany, additional compensations above 75% are permitted (the so-called supercap). For Spain, the compensation amounts to €600 million.
Table 2. Evolution of the average daily market price (2015–2025)
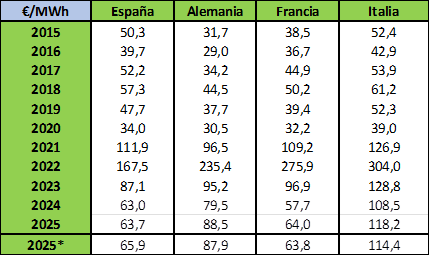
Source: Epexspot, OMIE, OMIP, Own elaboration.
(*) Average accumulated spot price up to the update date, completed with immediate futures until year-end.
FUNDAMENTALS
-
Evolution of coal prices
-
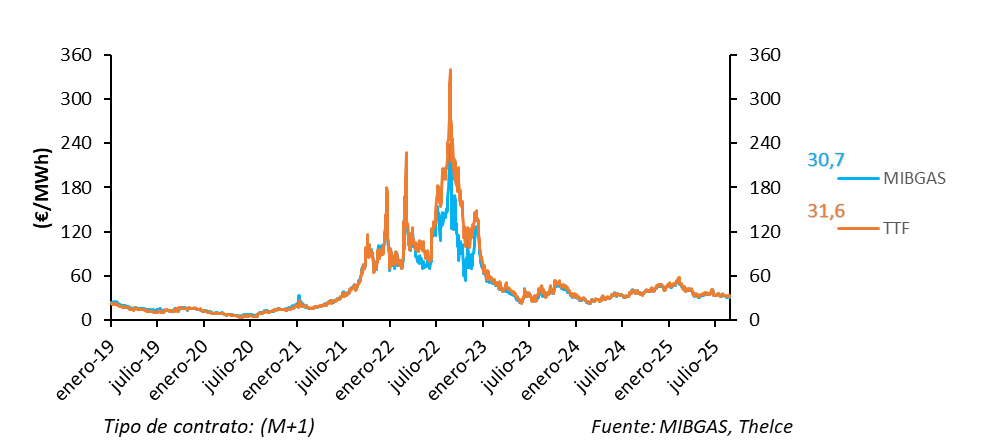
Evolution of natural gas prices
-
Evolution of Brent crude prices
-
Evolution of CO₂ allowance prices
-
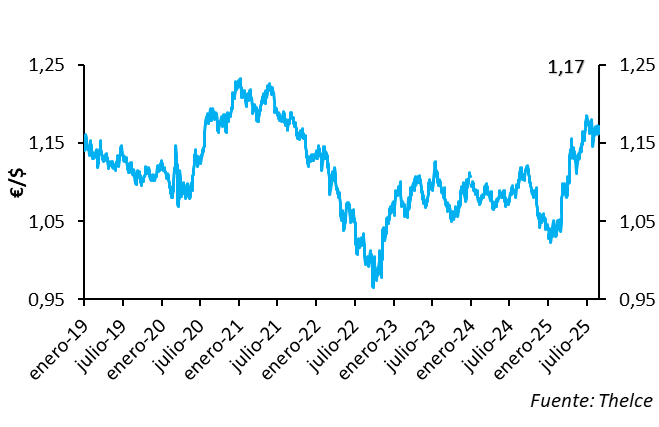
Evolution of $/€ exchange rate
-
Evolution of MIBGAS – TTF natural gas spread